
CASE STUDY
How a National Grocery Chain Found Over $500K in Fleet Savings
A national grocery chain was managing a mixed motive power fleet across 20 distribution sites with power studies on file and equipment purchased based on professional recommendations. What continuous cellular monitoring found across batteries, chargers, and trucks surprised everyone — including the people who managed the fleet.
20 Sites | 75 Days of Continuous Monitoring | No New Equipment Purchased
Get a Clear View of Your Mixed Fleet's Energy & Utilization
Battery, charger, and equipment visibility across mixed fleets — helping you make smarter decisions on upgrades, lithium conversion, and expansion.
Works Across Mixed Fleets | Cellular Connected
Multi-Site Ready | No OEM Lock-In
THE CHALLENGE
A Well-Managed Fleet. An Incomplete Picture.
The operation wasn't broken. Power studies had been conducted. Equipment was purchased based on professional recommendations. Maintenance schedules were followed across all 20 sites.
But as the fleet grew — more sites, more trucks, more equipment from different manufacturers — the ability to see how the fleet was actually performing across the full network became harder to maintain. Each site had its own picture. Nobody had the whole one.
The questions that couldn't be answered with confidence:
- Were the batteries sized correctly for how each site actually runs — or for how they were expected to run at peak?
- Was the charger infrastructure at each location being fully utilized — or were some assets sitting idle that nobody had tracked?
- Which trucks were carrying the operational load — and which ones were effectively backup capacity paying full ownership cost?
Without continuous, connected visibility across all 20 sites, every answer was an estimate.
" Every site had data. Nobody had a complete picture."
THE APPROACH
Continuous Cellular Monitoring. No Wi-Fi Required. No New Equipment Purchased.
SCT deployed Battlink, Charglink, and Truklink across the full 20-site network. Each device connects over cellular — no facility Wi-Fi dependency, no IT infrastructure required at any location. The monitoring ran continuously across all three asset classes simultaneously.
Battlink — Battery Intelligence
Continuous utilization tracking across every battery in the fleet — actual daily capacity draw versus installed capacity, charge cycle patterns, and health over time. Works across lead-acid and Li-Ion from any manufacturer.
Charglink — Charger Intelligence
Charger activity and performance monitoring across all 20 sites — usage rates, idle detection, charging event timing relative to utility rate windows, and missing or misallocated units.
Truklink — Truck Utilization
Truck-level utilization data across every OEM brand and model in the fleet — which assets carry the load, which run below capacity, and how the distribution varies across sites and shifts.
The engagement ran for 75 days. During that period, the platform built a continuous record across every battery, charger, and truck in the network — not a snapshot, not a study window, but a rolling picture that captured seasonal variation, shift changes, and the full range of how 20 different sites actually operate.
Why Cellular Connectivity Mattered Here
In a 20-site network, Wi-Fi coverage consistency is never guaranteed. SCT's cellular-connected devices transmitted data from every location without requiring facility networking infrastructure — which meant the monitoring worked everywhere, from day one.
THE FINDINGS
Three Areas. Consistent Patterns. Numbers That Changed the Conversation.
Across all 20 sites, the monitoring surfaced findings in three categories. Each one pointed to a specific type of decision. Each one had data behind it that the operation had never had access to before.

Finding 1 — Battery Capacity vs. Daily Demand
Batteries across the fleet were sized for peak demand — the standard approach for a study-based recommendation. Continuous monitoring showed what daily demand actually looked like across all 20 sites. The gap between installed capacity and average daily utilization was consistent and measurable. That gap became the basis for right-sizing future battery purchases — not on assumption, but on 75 days of actual measured draw.
So what?
The next battery replacement cycle across the network can be scoped with precision rather than a peak-demand buffer. For a 20-site operation, that difference is significant.
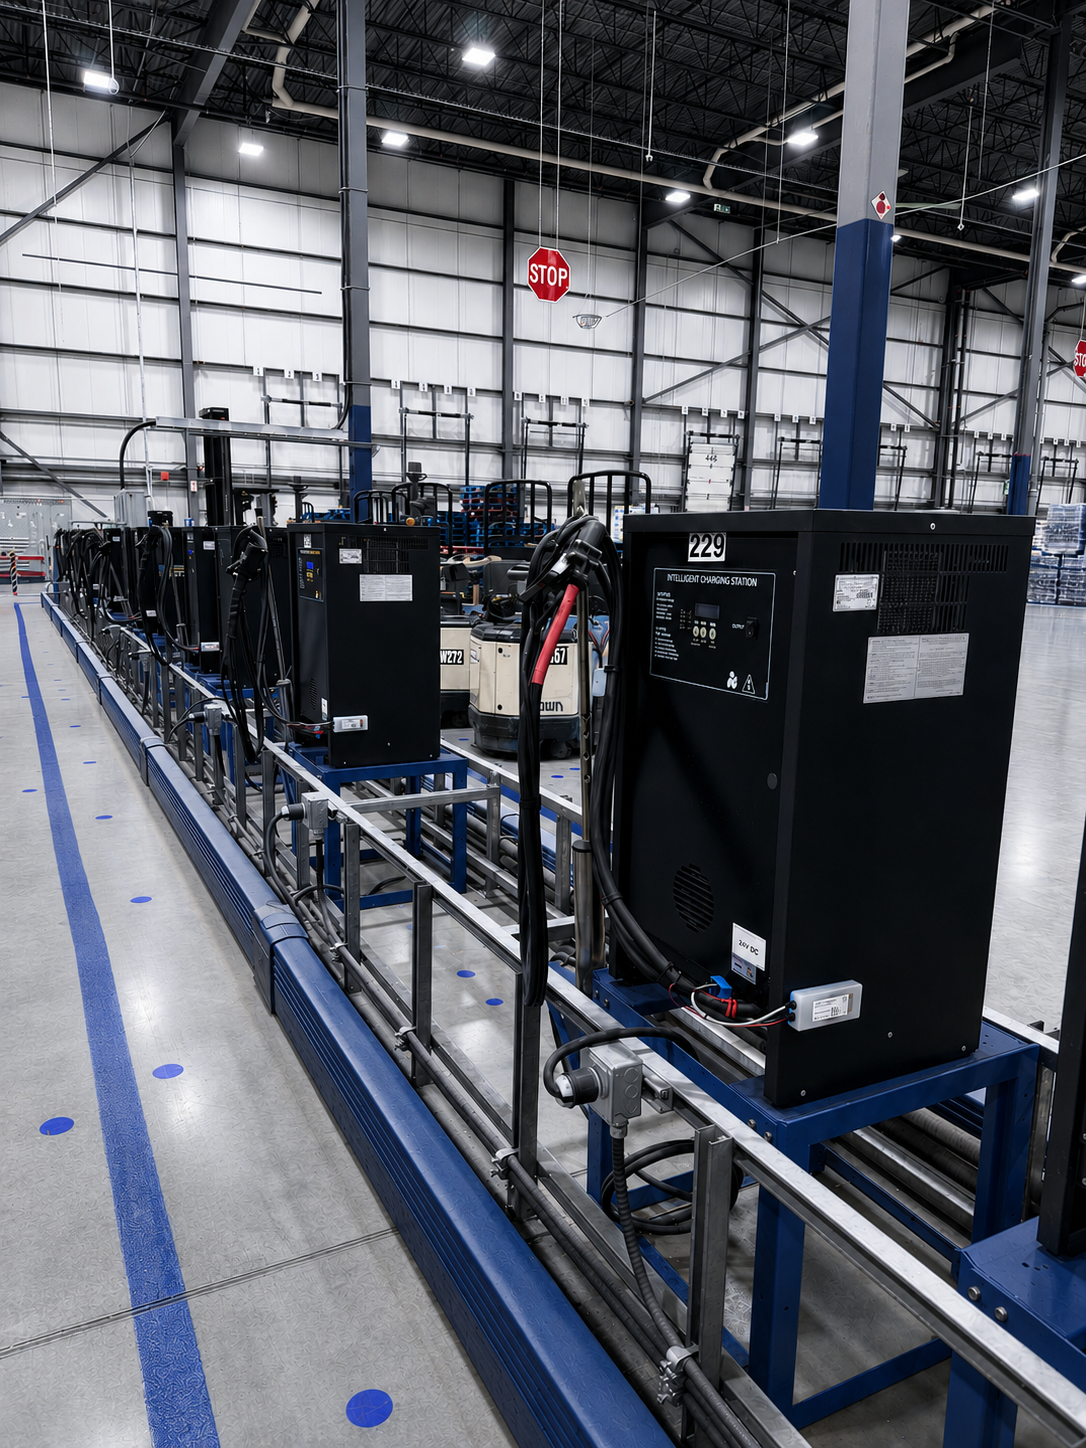
Finding 2 — Charger Infrastructure Utilization
Charger activity varied significantly across sites — not just between sites, but within them. Some units were running at high load. Others were barely registering. And the distribution of activity bore little resemblance to how the charging rooms were originally configured.
So what?
Infrastructure reallocation opportunities were identified at multiple sites — assets that could be moved to higher-demand locations before any new charger purchases were considered. Charging event timing also surfaced off-peak windows at several sites that hadn't been utilized, directly affecting the monthly energy bill.
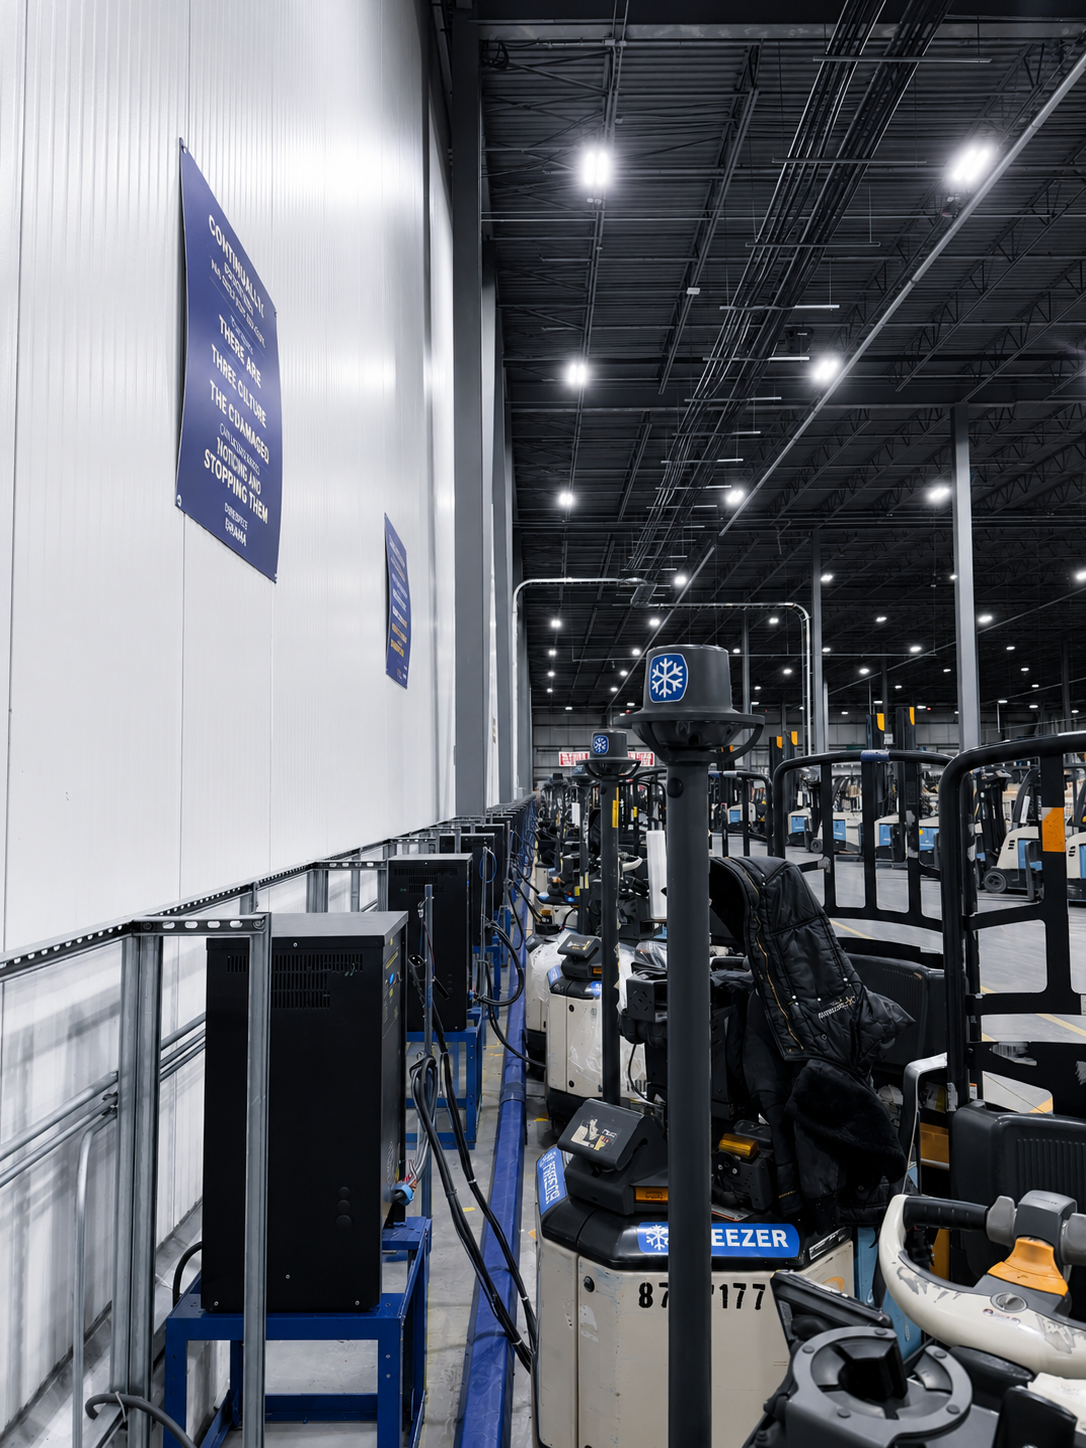
Finding 3 — Truck Utilization Across the Network
Truck utilization data was one of the most consistent findings across the 20 sites. A pattern emerged that repeated across locations: a small number of trucks carrying the majority of the operational load, while others ran at a fraction of their capacity. The imbalance wasn't visible in any single site's data — it became clear across the full network view.
So what?
Utilization data provided the foundation for fleet right-sizing conversations — which trucks were genuinely needed, which were effectively backup capacity, and where renting at peak made more financial sense than owning year-round.
THE IMPACT
Over $500K in Identified Savings. Found in 75 Days.
"The savings were already there. The monitoring made them visible."
The findings across all three categories translated into identified savings opportunities that the operation could act on — in the current equipment cycle, in the next replacement decision, and in the ongoing energy costs at each location.
The savings weren't created by the monitoring. They were already in the fleet. The monitoring made them visible for the first time — across all 20 sites, simultaneously, with the data to back every finding.
What the operation now had that it didn't before:
-
A current, continuous picture of battery utilization across every site — replacing peak-demand assumptions with measured daily reality
-
Charger activity data that identified reallocation opportunities before any expansion was considered
-
Truck utilization profiles by asset, by site, and across the full network — the foundation for a right-sizing conversation grounded in evidence
Get the Full Case Study
The complete findings, methodology, and savings breakdown — in one document.
FREQUENTLY ASKED QUESTIONS
What People Ask Before Downloading
How much can continuous fleet monitoring save?
Savings vary based on fleet size, configuration, and current visibility. In this 20-site national grocery chain engagement, SCT identified over $500,000 in savings opportunities across batteries, chargers, and trucks in 70 days of continuous monitoring. The most consistent finding across SCT-monitored fleets is that the gap between installed capacity and actual daily demand is larger than most operations expect — creating right-sizing and reallocation opportunities that directly affect capital spend.
What does continuous fleet monitoring actually find?
Three categories surface consistently: battery capacity gaps (installed capacity running above daily demand), charger infrastructure imbalances (uneven utilization across units and locations), and truck utilization variation (a small number of assets carrying most of the load). The specific findings vary by fleet, but the patterns repeat across operations of different sizes and industries.
How does SCT's monitoring work across multiple sites?
SCT's devices — Battlink, Charglink, and Truklink — connect over cellular. No facility Wi-Fi is required. This means the monitoring works consistently across all locations regardless of each site's networking infrastructure. For multi-site operations, this is the difference between partial visibility and a complete network picture.
Does the monitoring require new equipment?
No. SCT's monitoring devices are installed on existing batteries, chargers, and trucks — regardless of manufacturer or model. The 20-site grocery chain engagement documented in this case study identified over $500K in savings without the operation purchasing a single new piece of equipment.
How long does it take to see results?
Meaningful patterns typically emerge within the first 30 days. A complete picture — including seasonal variation and cross-site comparisons — develops over 60 to 90 days. The 75-day engagement in this case study surfaced over $500K in identified savings within that window.
Is this case study relevant to my operation if I don't run a grocery chain?
Yes. The three categories of findings — battery utilization gaps, charger infrastructure imbalances, and truck utilization variation — are consistent across industries. The grocery chain's 20-site scope and mixed fleet composition reflects the operational profile of most medium-to-large motive power fleets in warehousing, food and beverage, manufacturing, and retail distribution. The specific numbers will differ. The pattern is highly repeatable.
WHAT MADE THIS POSSIBLE
The Smart Telemetrics Platform
.jpg?width=2000&name=110525-SCT-Install-13%20(1).jpg)
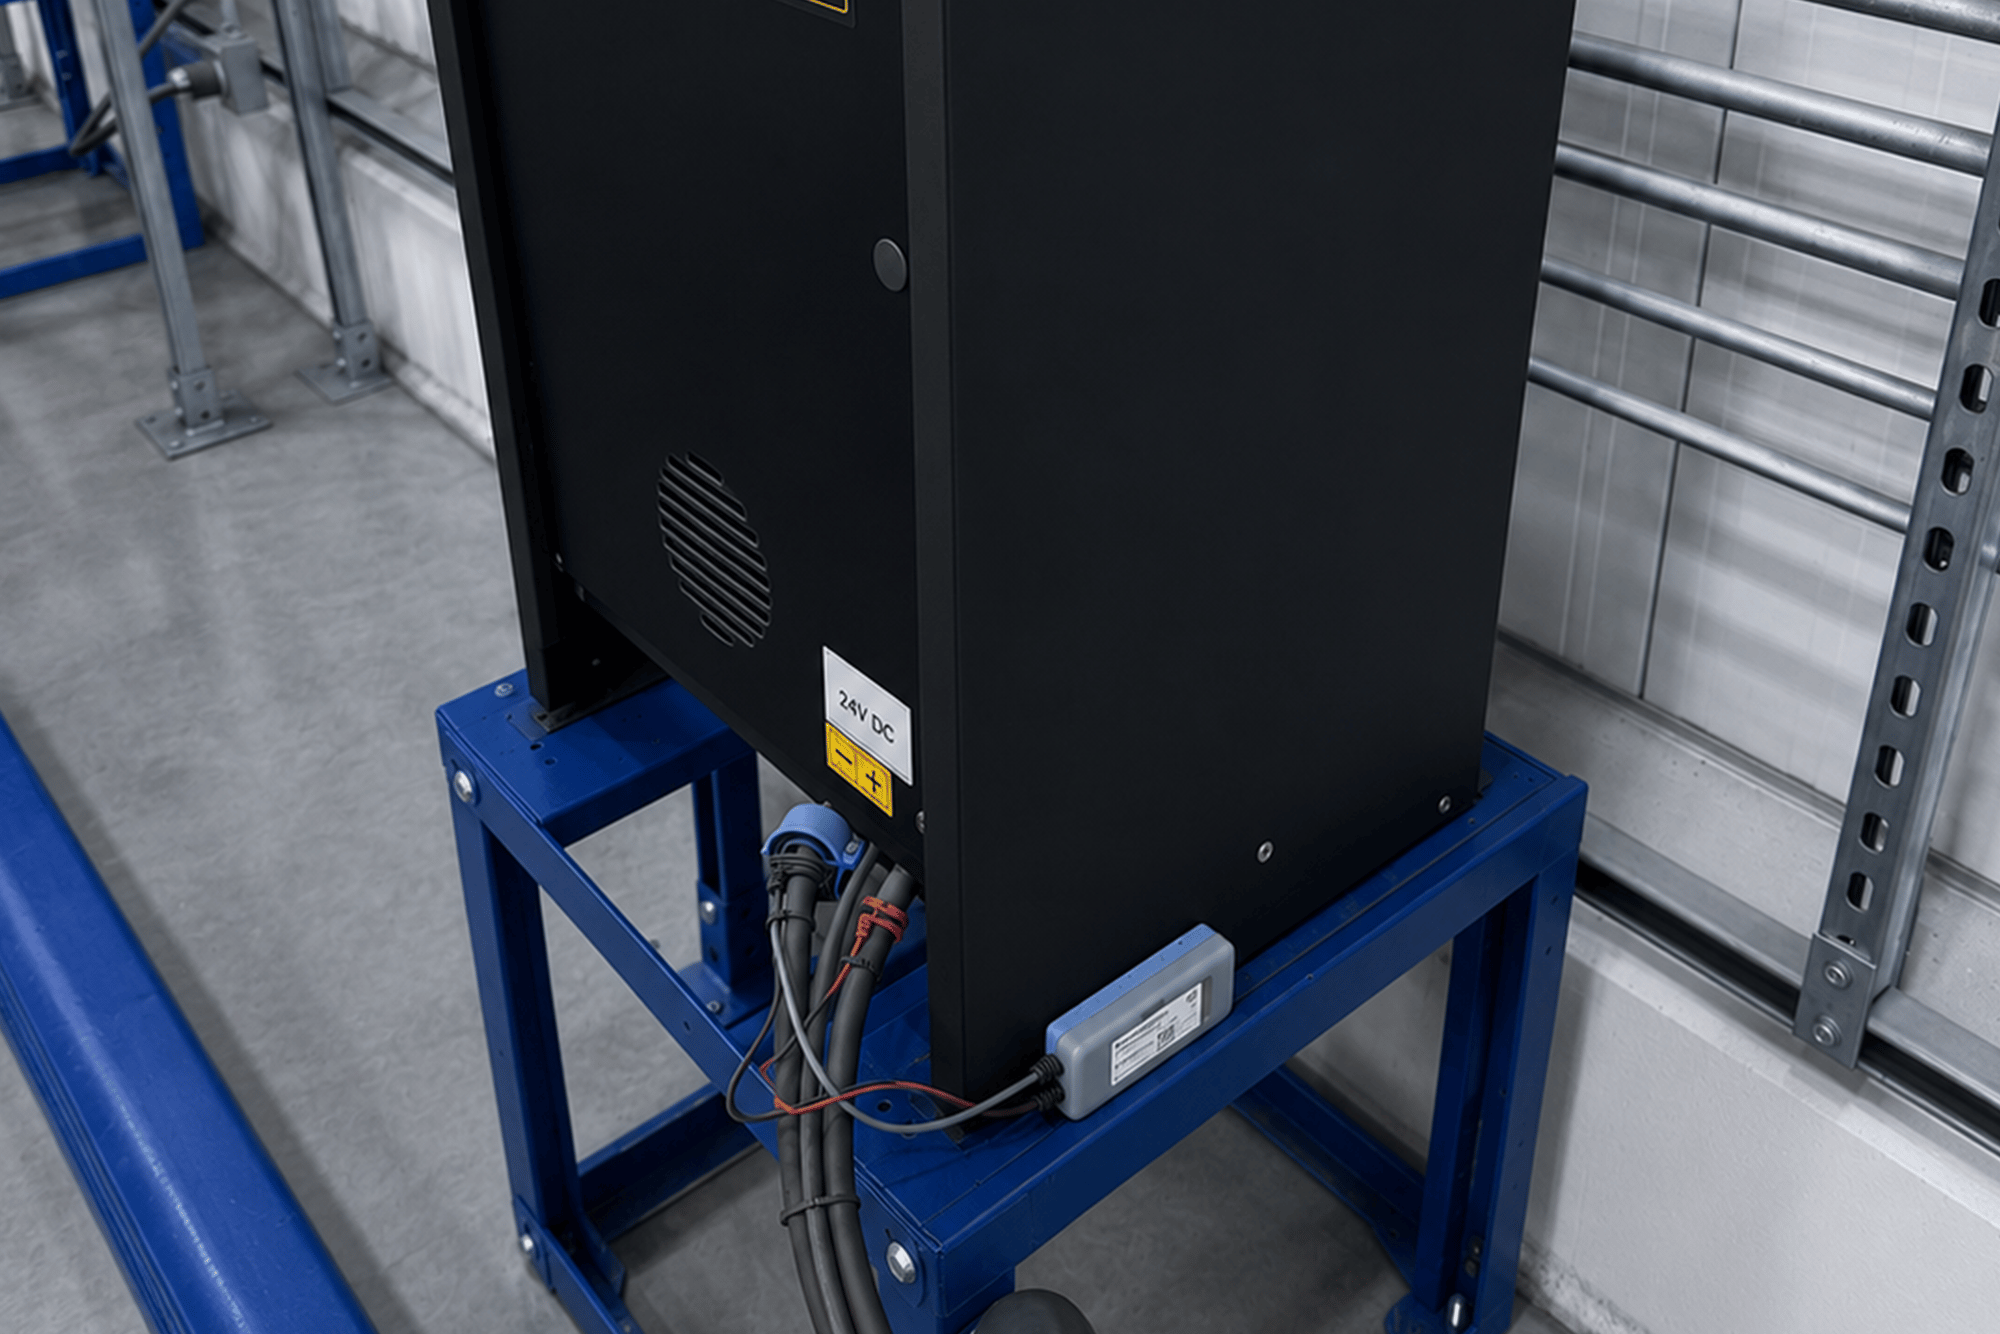
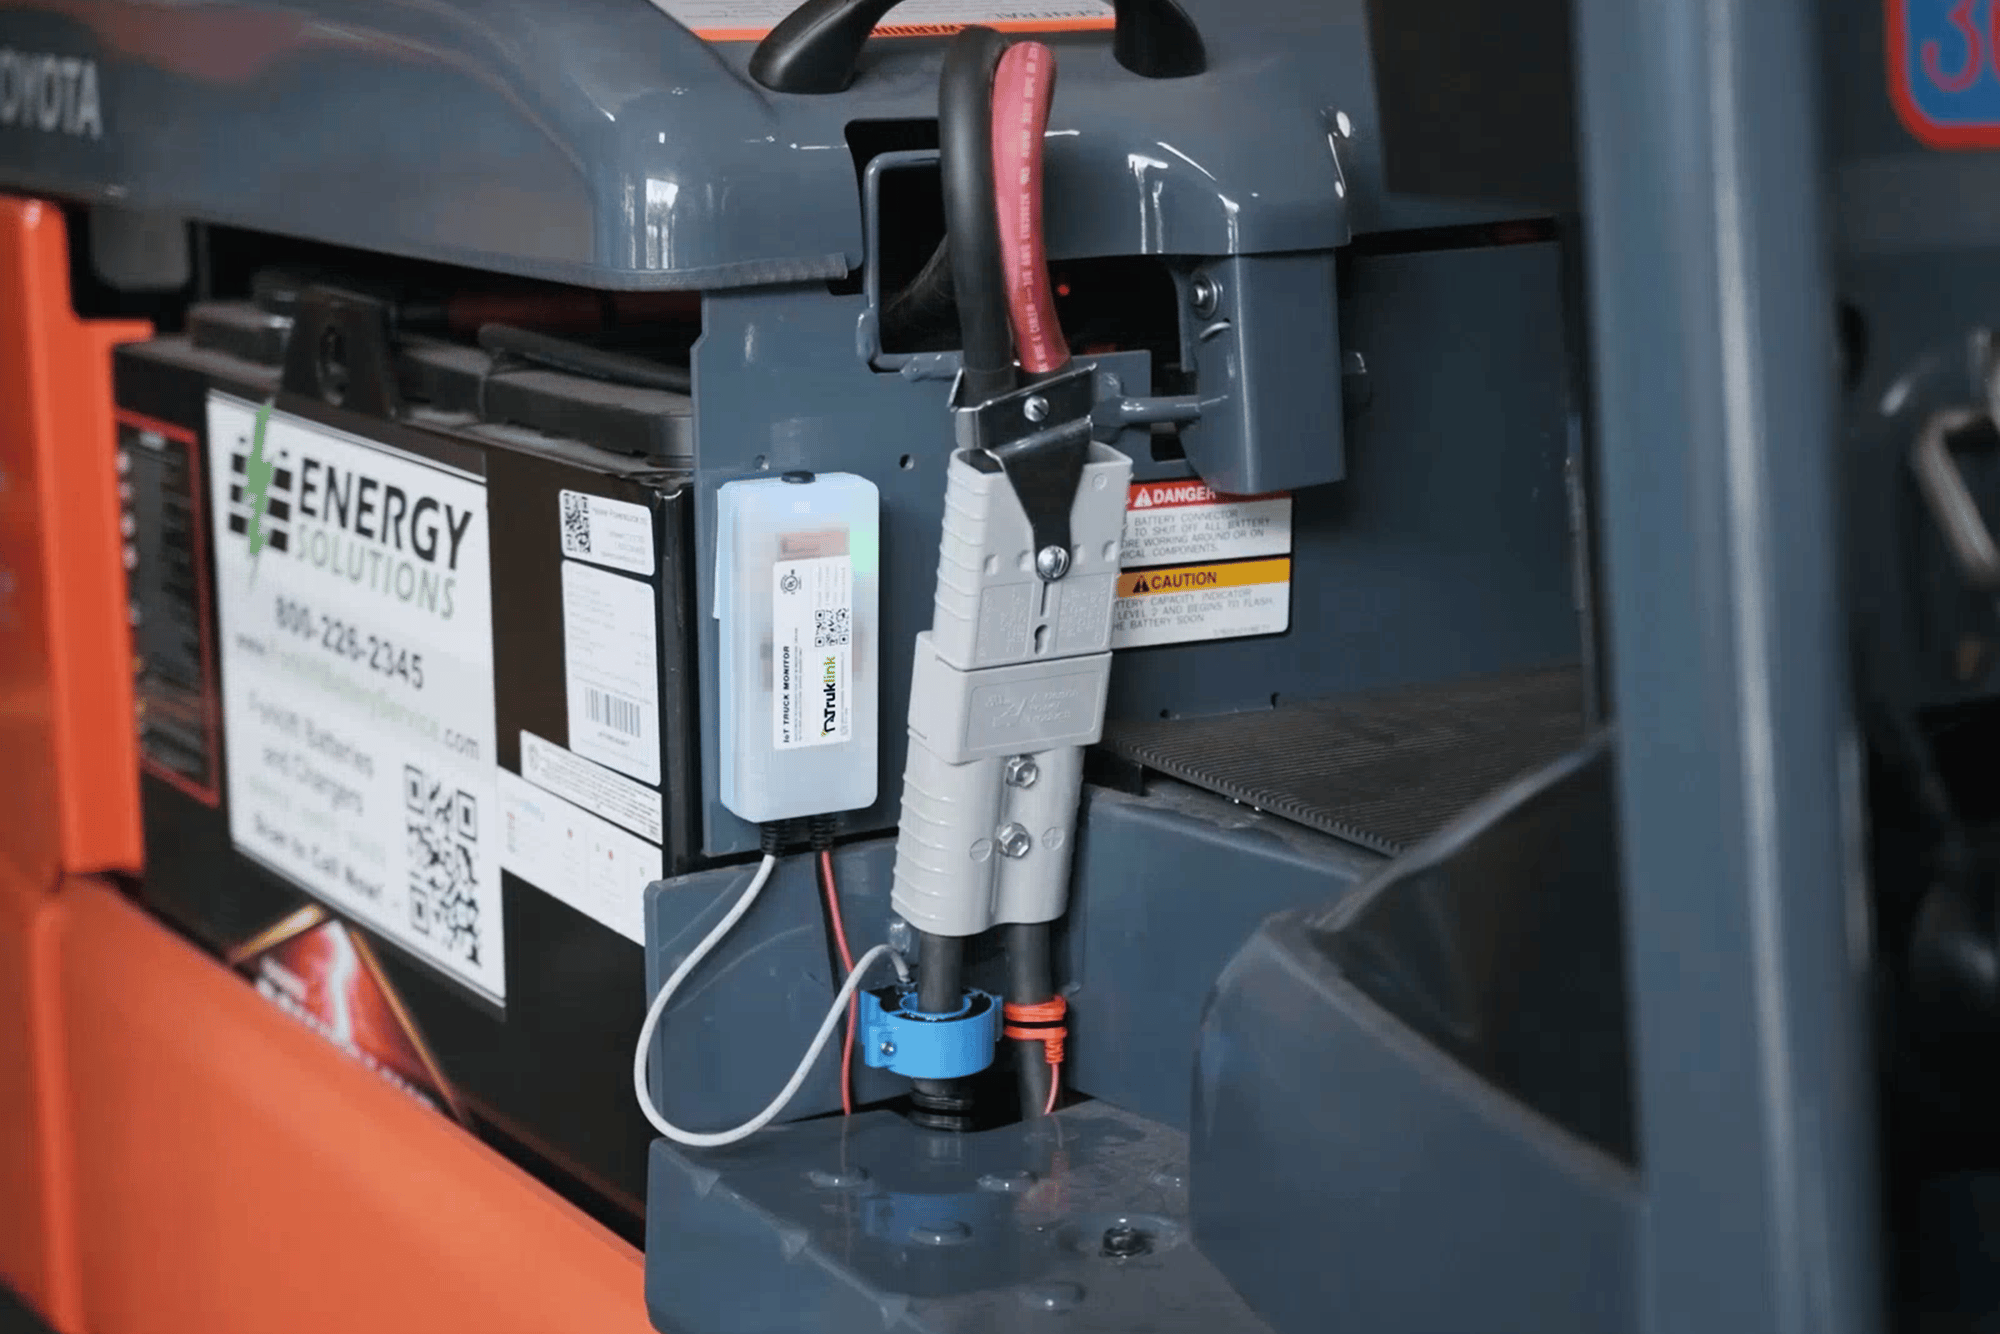
Smart Telemetrics brings all three data streams into one continuous, cellular-connected view — brand-agnostic, no Wi-Fi required, built for mixed fleets.
See What Your Fleet Would Find.
Request a Fleet Visibility Review — a current-state picture of your batteries, chargers, and trucks. No equipment purchase required.